It looks like HPE’s all-flash StoreServ 8450 is blowing the competition out the water after some notable SPC-1 benchmark results.The SPC - 1 (Storage Performance Council) provides a source of comparative storage performance information that is objective, relevant, and verifiable. This benchmark is designed to be vendor/platform independent and are applicable across a broad range of storage configuration and topologies.
The results of the latest benchmark, released on March 8, 2016 demonstrated the BEST SPC-1 price/performance result among all participating external arrays (think Dell Storage SC4020, EMC VNX8000, X-IO ISE 920 G3 AFA, etc.), including all-flash arrays. Now noted as the most affordable external all-flash array on the planet, HPE’s StoreServ 8450 achieved a world-leading result of $0.23 SPC-1 $/IOPS.
Why is this impressive? The other top 10 external arrays averaged $0.47 SPC-1 $/IOPS.
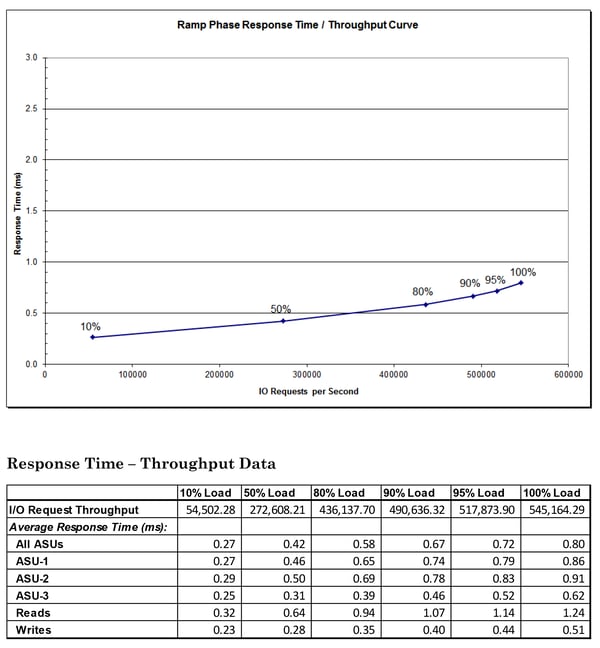
The buck doesn’t stop there. The SPC-1’s Executive Summary (details included below) also reported a configuration price of $126,558.24 for the 8450, the lowest of the competition. And an SPC-1 IOPS of 545,164 at 0.80ms latency.
Check out the rest of the Executive Summary Below:
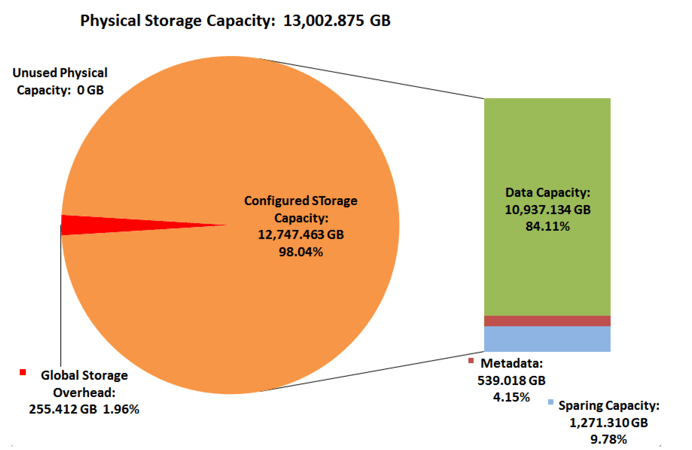
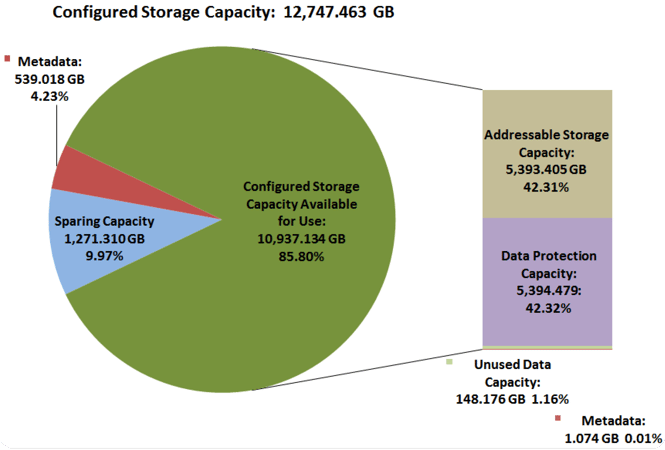
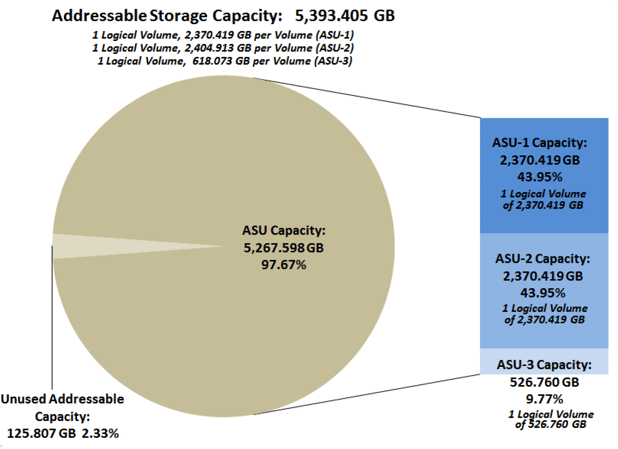
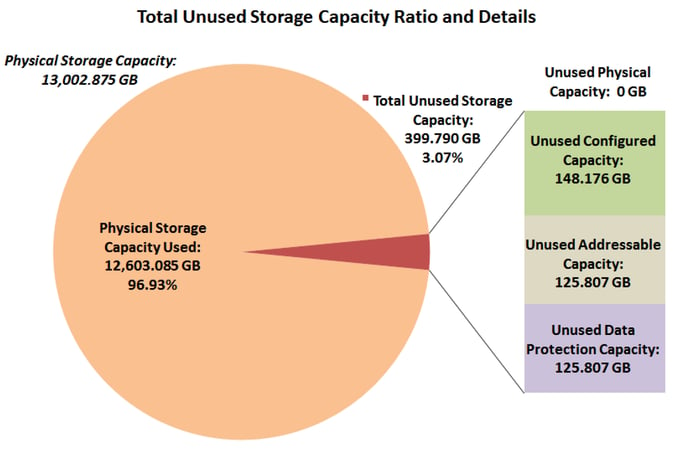
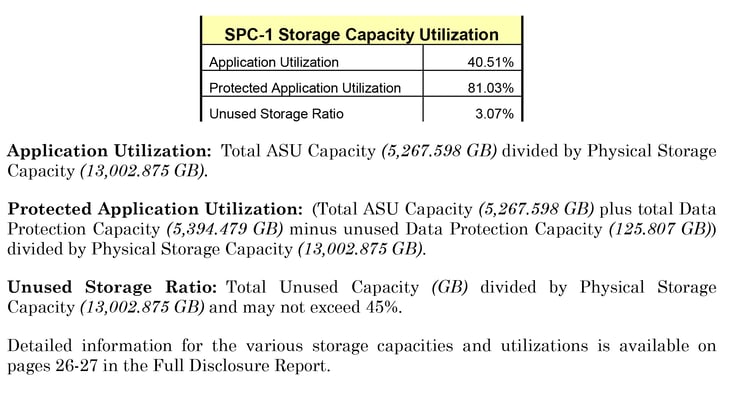
The following four charts and table document the various storage capacities used in the benchmark, and their relationships, as well as the storage utilization values required to be reported.
Response Time - Throughput Curve
The Response Time-Throughput Curve illustrates the Average Response Time (milliseconds) and I/O Request Throughput at 100%, 95%, 90%, 80%, 50%, and 10% of the workload level used to generage the SPC-1 IOPS metric.
The Average Response Time measured at the any of the above load points cannot exceed 30 milliseconds or the benchmark measurement is invalid.
